Windows on the World Maps: Power, Plunder and Possession
Similar Content
Browse content similar to Windows on the World. Check below for episodes and series from the same categories and more!
Transcript
| Line | From | To | |
|---|---|---|---|
I'm going left to my favourite coffee shop, | 0:00:05 | 0:00:08 | |
which does the best coffee on the street. | 0:00:08 | 0:00:10 | |
Then I come straight back out and I'll call into the paper shop, | 0:00:10 | 0:00:13 | |
because my friend KC runs it and we always have a joke. | 0:00:13 | 0:00:17 | |
I come out, go left, curve down here, big new-build place here. | 0:00:17 | 0:00:23 | |
I'm intrigued about what it's going to do to house prices, | 0:00:23 | 0:00:26 | |
so I'm always looking to see how that's going on. | 0:00:26 | 0:00:28 | |
Then I keep left, cross a bridge, which goes over the canal. | 0:00:28 | 0:00:33 | |
Then I'm going right along here, passing all the boats, and then | 0:00:33 | 0:00:37 | |
I'm going right here. Go left, | 0:00:37 | 0:00:40 | |
and there I am, I'm now into Oxford station. | 0:00:40 | 0:00:44 | |
I'm there in ten minutes and then I'm on my way. | 0:00:44 | 0:00:47 | |
Map making is a basic human instinct. | 0:00:48 | 0:00:51 | |
It's one of the ways we make sense of the world around us. | 0:00:51 | 0:00:56 | |
I've been studying and writing about maps for most of my working life. | 0:00:56 | 0:01:00 | |
I'm fascinated by the way they're like windows on to different times | 0:01:00 | 0:01:03 | |
and different cultures. | 0:01:03 | 0:01:05 | |
That map that I've produced is absolutely unique to me. | 0:01:07 | 0:01:11 | |
It's totally subjective. | 0:01:11 | 0:01:12 | |
I'm not interested in what's going on over here. | 0:01:12 | 0:01:15 | |
I haven't filled any of this area here. It's dead to me. | 0:01:15 | 0:01:18 | |
I've edited out what I don't want. | 0:01:18 | 0:01:20 | |
I'm doing what mapmakers tend to do. | 0:01:20 | 0:01:23 | |
They offer a specific perspective from their | 0:01:23 | 0:01:25 | |
own subjective experience, and the map reflects that. | 0:01:25 | 0:01:29 | |
In this series, I'm going to explore how maps give an insight | 0:01:31 | 0:01:34 | |
into the political and cultural forces that drive society. | 0:01:34 | 0:01:39 | |
Wow! | 0:01:40 | 0:01:41 | |
I'm going to dig beneath the surface of some extraordinary maps | 0:01:44 | 0:01:48 | |
to reveal stories of power, | 0:01:48 | 0:01:50 | |
plunder, | 0:01:50 | 0:01:53 | |
and possession. | 0:01:53 | 0:01:54 | |
In this programme, I'm going back to where map-making began. | 0:01:57 | 0:02:00 | |
I'll find out what first drove people to create maps | 0:02:02 | 0:02:06 | |
before they could even write. | 0:02:06 | 0:02:08 | |
How they evolved, not just to depict the world, | 0:02:08 | 0:02:11 | |
but also to exert power and authority over it. | 0:02:11 | 0:02:14 | |
I'll discover some of the great scientific advances | 0:02:14 | 0:02:17 | |
that made this possible. | 0:02:17 | 0:02:20 | |
And I'll explore how the style of modern maps that we take for granted | 0:02:20 | 0:02:24 | |
as objective, even natural, is nothing of the sort. | 0:02:24 | 0:02:28 | |
Valcamonica in Northern Italy. | 0:02:51 | 0:02:53 | |
Home to one of the oldest settlements in Europe. | 0:02:53 | 0:02:56 | |
For a map fanatic like me, | 0:02:59 | 0:03:00 | |
it's most famous for being the cradle of map making. | 0:03:00 | 0:03:04 | |
The map created here | 0:03:10 | 0:03:11 | |
is considered to be one of the oldest maps in the world. | 0:03:11 | 0:03:14 | |
This is cartography's year zero | 0:03:14 | 0:03:16 | |
and it gives us some vital clues as to why people | 0:03:16 | 0:03:19 | |
were compelled to make maps before they even learnt to write. | 0:03:19 | 0:03:23 | |
The map is located high in the Eastern Alps, | 0:03:28 | 0:03:30 | |
near the small village of Bedolina. | 0:03:30 | 0:03:33 | |
It has survived for nearly 3,000 years | 0:03:33 | 0:03:36 | |
and was only identified by archaeologists 80 years ago. | 0:03:36 | 0:03:40 | |
So here it is. It's extraordinary. | 0:04:03 | 0:04:06 | |
And as I look at it, what's interesting is that there's | 0:04:06 | 0:04:10 | |
clearly a structure, there's a code, | 0:04:10 | 0:04:12 | |
there's a system about what's being represented here. | 0:04:12 | 0:04:15 | |
You can see these rectangles with dots in them represent fields. | 0:04:15 | 0:04:21 | |
And throughout, these lines, | 0:04:21 | 0:04:24 | |
which appear to represent some notion of the landscape. | 0:04:24 | 0:04:28 | |
There's timber-framed houses down here. | 0:04:28 | 0:04:30 | |
There's the roof and the main body of the house there. | 0:04:30 | 0:04:35 | |
There are stick figures, these warriors down here, | 0:04:35 | 0:04:39 | |
you can see a deer with four clearly marked legs. | 0:04:39 | 0:04:43 | |
And for me, it's actually incredibly moving | 0:04:43 | 0:04:45 | |
because this is where it all began. | 0:04:45 | 0:04:47 | |
This is the beginning of map making. | 0:04:47 | 0:04:49 | |
This is the origin of what I've been thinking about for all this time. | 0:04:49 | 0:04:54 | |
It's absolutely breathtaking. | 0:04:54 | 0:04:56 | |
The origins and purpose of the Bedolina Map | 0:05:04 | 0:05:06 | |
have mystified archaeologists for years. | 0:05:06 | 0:05:09 | |
This is not a geographically accurate map of the area. | 0:05:11 | 0:05:15 | |
You couldn't use it to get from A to B. | 0:05:15 | 0:05:17 | |
So what was it for? | 0:05:17 | 0:05:19 | |
After analyzing rock drawings and using comparative dating techniques, | 0:05:21 | 0:05:25 | |
archaeologists now believe it was | 0:05:25 | 0:05:27 | |
created by an ancient tribe, the Cammuni, | 0:05:27 | 0:05:31 | |
at a critical moment in their history. | 0:05:31 | 0:05:33 | |
3,000 years ago, the Cammuni were pioneering a whole new way of life. | 0:05:33 | 0:05:39 | |
Agriculture was replacing the hunter-gatherer lifestyle | 0:05:39 | 0:05:42 | |
and creating a more complex social structure. | 0:05:42 | 0:05:45 | |
Archaeologist Alberto Marretta | 0:05:47 | 0:05:50 | |
thinks this is the key to unlocking the map's secrets. | 0:05:50 | 0:05:55 | |
We have evidence from the rock art and from the archaeology that | 0:05:55 | 0:06:00 | |
in Valcaominica there were aristocracies here. | 0:06:00 | 0:06:04 | |
Some sort of small groups of people controlling the small communities | 0:06:04 | 0:06:10 | |
and probably controlling the land. | 0:06:10 | 0:06:12 | |
And do you think that's important in terms of how they used the map? | 0:06:12 | 0:06:16 | |
I think that this group of people, this aristrocracies, | 0:06:18 | 0:06:23 | |
are symbolizing through the map the possession of the landscape | 0:06:23 | 0:06:28 | |
that they had in this part of the valley. | 0:06:28 | 0:06:32 | |
It seems that the tribal elites | 0:06:35 | 0:06:36 | |
were using the map to celebrate their ownership of the land. | 0:06:36 | 0:06:40 | |
They draw the map probably to represent not a real landscape, | 0:06:42 | 0:06:48 | |
but to represent an ideal landscape. | 0:06:48 | 0:06:52 | |
It was some sort of... | 0:06:52 | 0:06:55 | |
supernatural representation of the landscape | 0:06:55 | 0:06:59 | |
as it should be after you and after your sons | 0:06:59 | 0:07:03 | |
and after your time has passed on. | 0:07:03 | 0:07:07 | |
-So it's a very symbolic image. -Yeah. | 0:07:07 | 0:07:09 | |
In some sense it is highly symbolic. | 0:07:09 | 0:07:13 | |
'Alberto believes these images of well-ordered fields | 0:07:13 | 0:07:17 | |
'and plentiful crops were a vision of future prosperity. | 0:07:17 | 0:07:21 | |
'The map was designed to bolster the power of the ruling elite | 0:07:21 | 0:07:24 | |
'by reassuring the Cammuni people | 0:07:24 | 0:07:26 | |
'that life would improve under their leadership. | 0:07:26 | 0:07:29 | |
'The map is a fascinating window into an ancient culture. | 0:07:31 | 0:07:35 | |
'And it reveals that map-making was bound up with power and politics | 0:07:36 | 0:07:42 | |
'right from the start.' | 0:07:42 | 0:07:43 | |
As ancient societies became more complex, so too did their maps. | 0:07:49 | 0:07:54 | |
Within the next 1,000 years, | 0:07:55 | 0:07:58 | |
the Romans were using maps | 0:07:58 | 0:08:00 | |
to help them build the greatest empire in the world. | 0:08:00 | 0:08:03 | |
They created maps of their towns, regions and colonies. | 0:08:04 | 0:08:08 | |
Many have been lost. | 0:08:13 | 0:08:15 | |
This is a copy of one of the few to have survived | 0:08:15 | 0:08:18 | |
and it's quite spectacular. | 0:08:18 | 0:08:20 | |
This is a map of the world in Roman times. | 0:08:30 | 0:08:33 | |
It's the longest map I have ever seen in my entire life. | 0:08:33 | 0:08:36 | |
It stretches all the way from Sri Lanka and India | 0:08:36 | 0:08:40 | |
down here in the east, | 0:08:40 | 0:08:42 | |
right along here to the furthest western point, | 0:08:44 | 0:08:47 | |
which shows the southern coast of Great Britain. | 0:08:47 | 0:08:51 | |
It is an absolutely extraordinary map. | 0:08:55 | 0:08:57 | |
It's six-and-a-half metres in length. | 0:08:57 | 0:08:59 | |
Scholars actually believe it was longer and that it's lost about | 0:08:59 | 0:09:03 | |
two metres, which rather tantalisingly | 0:09:03 | 0:09:05 | |
would have given us a much better picture of the British Isles. | 0:09:05 | 0:09:09 | |
Here's Germany, labelled Alemannia, just squeezed into a few centimetres | 0:09:19 | 0:09:24 | |
up here on the north coast of Europe. | 0:09:24 | 0:09:27 | |
There's the River Rhine running right along there. | 0:09:27 | 0:09:30 | |
And here's the Mediterranean, | 0:09:34 | 0:09:37 | |
like a long, snaking river, moving right down there. | 0:09:37 | 0:09:42 | |
And probably the most prominent landmass on the map, | 0:09:46 | 0:09:50 | |
not surprisingly, is Italy, | 0:09:50 | 0:09:53 | |
stretching right down here - there's Rome - it goes all the way down. | 0:09:53 | 0:09:56 | |
You can see the boot, and there's Sicily. | 0:09:56 | 0:10:00 | |
But nothing like we understand it today. | 0:10:00 | 0:10:03 | |
What's really striking about looking at this map | 0:10:06 | 0:10:10 | |
with the depiction of Europe, North Africa and Asia, | 0:10:10 | 0:10:13 | |
in this shape there's no way that this could be an | 0:10:13 | 0:10:16 | |
accurate representation of how the Romans saw the world. | 0:10:16 | 0:10:19 | |
The geography is obviously way out. | 0:10:21 | 0:10:25 | |
And yet there are some details of astonishing accuracy. | 0:10:25 | 0:10:29 | |
These red lines that criss-cross the map are the | 0:10:29 | 0:10:33 | |
famous straight Roman roads running across its surface. | 0:10:33 | 0:10:38 | |
And above them are symbols exhibiting the distance | 0:10:38 | 0:10:41 | |
between places in terms of leagues or miles, depending where you are. | 0:10:41 | 0:10:47 | |
There's Rome. | 0:10:47 | 0:10:49 | |
On the red Roman road, the Vatican. | 0:10:49 | 0:10:52 | |
the symbol just above it shows that it's just one mile. | 0:10:52 | 0:10:55 | |
But the map is covered with these kind of symbols. | 0:10:57 | 0:11:01 | |
You have another one here | 0:11:01 | 0:11:02 | |
which shows the distance from Strasburg, shown there, | 0:11:02 | 0:11:06 | |
to Mainz, there. What happens is that the Roman numerals tell you | 0:11:06 | 0:11:10 | |
how far you're going from Strasburg to the next town or village, | 0:11:10 | 0:11:15 | |
which is labelled with seven. | 0:11:15 | 0:11:17 | |
The distance here is 18. | 0:11:17 | 0:11:21 | |
All the way to Mainz, which is 74 leagues altogether. | 0:11:21 | 0:11:25 | |
Route markings, distances clearly annotated, | 0:11:25 | 0:11:29 | |
towns where people could stop off for the night. | 0:11:29 | 0:11:33 | |
These details led to the belief | 0:11:33 | 0:11:35 | |
that the map was the equivalent of a modern road atlas. | 0:11:35 | 0:11:38 | |
But just look at this map. It's hardly pocket size, is it? | 0:11:41 | 0:11:44 | |
Imagine strapping it to the back of a horse and then hauling it out | 0:11:44 | 0:11:48 | |
every time you lost your way. | 0:11:48 | 0:11:50 | |
As a route finder, it's completely impractical. | 0:11:50 | 0:11:53 | |
To understand the purpose of this map, | 0:11:57 | 0:12:00 | |
we need to look back to the time when it was created, around 300 AD. | 0:12:00 | 0:12:04 | |
By then, the Empire had already been under attack | 0:12:06 | 0:12:09 | |
from invading Barbarians. | 0:12:09 | 0:12:11 | |
To meet the threat, Rome's armies had expanded | 0:12:11 | 0:12:13 | |
and citizens lived in the grip of authoritarian rule. | 0:12:13 | 0:12:16 | |
But the map shows only peace and harmony. | 0:12:21 | 0:12:24 | |
Spa and bath towns are clearly marked all over the map. | 0:12:24 | 0:12:28 | |
So where are the fortifications and garrisons? | 0:12:31 | 0:12:34 | |
And where are the divisions between regions? | 0:12:34 | 0:12:38 | |
This seems to be a land without borders. | 0:12:38 | 0:12:41 | |
In reality, the Empire was divided and ruled by four competing leaders. | 0:12:41 | 0:12:46 | |
It's been suggested that this map of the Roman world | 0:12:46 | 0:12:50 | |
may have hung behind one of their thrones. | 0:12:50 | 0:12:53 | |
With its remarkable details of roads and distances, this map was designed | 0:12:53 | 0:12:58 | |
to give the impression of order and control. | 0:12:58 | 0:13:01 | |
So, while the Bedolina Map in the Alps promised the people a better | 0:13:02 | 0:13:06 | |
world to come, this map is trying to hide the fact | 0:13:06 | 0:13:09 | |
that the power and riches of Empire are under threat. | 0:13:09 | 0:13:13 | |
This map glosses over the messy, complex reality | 0:13:18 | 0:13:22 | |
of internal tensions and external threats. | 0:13:22 | 0:13:25 | |
Its main message is one of unity | 0:13:25 | 0:13:27 | |
and that made it an incredibly powerful political tool. | 0:13:27 | 0:13:31 | |
By the 12th century, sophisticated map-making | 0:13:40 | 0:13:43 | |
was an essential tool of imperial power. | 0:13:43 | 0:13:46 | |
And Chinese maps were among the most sophisticated on Earth. | 0:13:46 | 0:13:49 | |
I'm going to Pembroke College in Oxford to have a look at one. | 0:13:51 | 0:13:54 | |
It's called the Yu Ji Tu, and it was carved on to | 0:13:56 | 0:14:00 | |
a metre-wide stone that was erected in a Chinese schoolyard in 1136. | 0:14:00 | 0:14:05 | |
Remarkably, it has all the hallmarks of a modern map. | 0:14:07 | 0:14:11 | |
It shows the whole Empire from an aerial perspective | 0:14:11 | 0:14:13 | |
and the gridlines suggest it's drawn to scale. | 0:14:13 | 0:14:16 | |
But just how accurate is it? | 0:14:18 | 0:14:21 | |
Historian Hilde De Weerdt is using a special technique | 0:14:21 | 0:14:25 | |
to compare it with a 21st century map. | 0:14:25 | 0:14:27 | |
So we start out by picking a few points on the historical map | 0:14:34 | 0:14:39 | |
to map onto the modern map. | 0:14:39 | 0:14:42 | |
So in effect you're going to overlay the 12th century map | 0:14:42 | 0:14:46 | |
-onto the modern map. -That's correct. | 0:14:46 | 0:14:49 | |
We will pick some places along the coast to start out with | 0:14:49 | 0:14:52 | |
and typically we want to pick a place that hasn't changed too much. | 0:14:52 | 0:14:58 | |
The first point we'll pick is a prefecture called Tai Zhou. | 0:14:58 | 0:15:01 | |
we see it here on the historical map. | 0:15:01 | 0:15:05 | |
One by one, Hilde picks out some of the towns and locations | 0:15:06 | 0:15:10 | |
that are marked on the historical map. | 0:15:10 | 0:15:12 | |
She then enters their modern co-ordinates, | 0:15:17 | 0:15:20 | |
allowing the map to be positioned against a satellite image. | 0:15:20 | 0:15:24 | |
First of all, it allows you to place a historical map very accurately. | 0:15:26 | 0:15:30 | |
The similarity between the maps is immediately obvious. | 0:15:33 | 0:15:37 | |
You can tell the coastline, the modern coastline, correlates to | 0:15:39 | 0:15:43 | |
the coastline as it is depicted on the historical map. | 0:15:43 | 0:15:47 | |
But the really astonishing thing is that the 37 locations | 0:15:49 | 0:15:52 | |
chosen by Hilde are remarkably close to their position on the modern map. | 0:15:52 | 0:15:56 | |
Wow, that's extraordinary, so that's an incredibly close fit between | 0:16:11 | 0:16:15 | |
the contemporary modern co-ordinates and the 12th century co-ordinates. | 0:16:15 | 0:16:20 | |
It is indeed quite striking | 0:16:20 | 0:16:21 | |
and we wouldn't be able to do that for a lot of other historical maps. | 0:16:21 | 0:16:25 | |
That's amazing! | 0:16:25 | 0:16:26 | |
We have no record of the surveying techniques used | 0:16:30 | 0:16:33 | |
to make this astonishingly accurate map. | 0:16:33 | 0:16:35 | |
And there's a mystery here. | 0:16:35 | 0:16:38 | |
For all its accuracy, | 0:16:38 | 0:16:39 | |
the Yu Ji Tu contains a number of glaring geographical errors. | 0:16:41 | 0:16:45 | |
The source of the Yellow River | 0:16:45 | 0:16:47 | |
is marked hundreds of kilometres away from its real location. | 0:16:47 | 0:16:52 | |
And here's a river which doesn't even exist. | 0:16:52 | 0:16:56 | |
So, what's really going on here? | 0:16:56 | 0:16:58 | |
The answer to this map-making mystery | 0:17:00 | 0:17:03 | |
can be found in the pages of this historical text. | 0:17:03 | 0:17:07 | |
It's called the Yu Gong. | 0:17:07 | 0:17:09 | |
It's a description of the landscape of China during the lifetime of | 0:17:09 | 0:17:13 | |
King Yu, a legendary leader from the 21st century BC. | 0:17:13 | 0:17:17 | |
The Great Yu was said to have had a comprehensive knowledge | 0:17:19 | 0:17:23 | |
of all of China. | 0:17:23 | 0:17:24 | |
And it was this book that formed the basis of all Chinese geography. | 0:17:24 | 0:17:28 | |
These writings were greatly revered by the Chinese. | 0:17:28 | 0:17:31 | |
It was almost a sacred text. | 0:17:31 | 0:17:34 | |
The name of the 12th century map, | 0:17:45 | 0:17:48 | |
Yu Ji Tu, translates as, "The map of the tracks of Yu". | 0:17:48 | 0:17:51 | |
This reveals its connection with the text of the Yu Gong. | 0:17:51 | 0:17:55 | |
The positioning of the source of the Yellow River | 0:17:56 | 0:17:59 | |
isn't the result of a 12th century survey. | 0:17:59 | 0:18:01 | |
It's been mapped according to the words of the Yu Gong. | 0:18:01 | 0:18:04 | |
That's why it's in the wrong place. | 0:18:04 | 0:18:07 | |
And that extra river over here, the Heishui, or "Black River", | 0:18:11 | 0:18:15 | |
is referred to in the Yu Gong, | 0:18:15 | 0:18:17 | |
so it was drawn on the map even though it didn't exist. | 0:18:17 | 0:18:22 | |
The map seems to be an attempt to portray an up-to-date image of China | 0:18:22 | 0:18:26 | |
without undermining Yu's ancient vision of the Empire. | 0:18:26 | 0:18:29 | |
12th Century map makers | 0:18:35 | 0:18:36 | |
must have known this information was inaccurate. | 0:18:36 | 0:18:39 | |
But the important thing was fidelity to Yu, | 0:18:39 | 0:18:42 | |
not geographical realism or accuracy. | 0:18:42 | 0:18:45 | |
Creating maps with this level of detail required huge resources. | 0:18:55 | 0:19:00 | |
It would be another 400 years before the means were available | 0:19:00 | 0:19:03 | |
to fund a national mapping project in England. | 0:19:03 | 0:19:07 | |
In 1539, Henry VIII commissioned a survey | 0:19:10 | 0:19:13 | |
of the entire English coastline. | 0:19:13 | 0:19:16 | |
But Henry didn't simply just want an impressive image of his Kingdom. | 0:19:16 | 0:19:21 | |
He wanted to defend it. | 0:19:21 | 0:19:23 | |
Local artists were ordered to make sketch maps of the coast. | 0:19:27 | 0:19:31 | |
Their drawings were sent to London, | 0:19:33 | 0:19:35 | |
where they were compiled into master maps for the King. | 0:19:35 | 0:19:39 | |
This is one of Henry's maps. | 0:19:48 | 0:19:50 | |
It's a giant birds' eye view of the coast, | 0:19:50 | 0:19:53 | |
all the way from Exeter, right down to Lands End in Cornwall. | 0:19:53 | 0:19:57 | |
It's a beautiful map, and it's a really, really important step in | 0:19:59 | 0:20:03 | |
the move towards geographical representation. | 0:20:03 | 0:20:07 | |
You see places in a level of realism | 0:20:08 | 0:20:11 | |
that the English had never seen before. | 0:20:11 | 0:20:14 | |
You've got Exeter in birds' eye view which is quite clear. | 0:20:14 | 0:20:17 | |
You have Plymouth represented here in a way that was completely new. | 0:20:20 | 0:20:26 | |
It's absolutely extraordinary. | 0:20:26 | 0:20:28 | |
The colouring, the whole detail. | 0:20:28 | 0:20:31 | |
This isn't just a beautiful map - | 0:20:31 | 0:20:33 | |
it's also an extremely strategic map with a very specific end in mind. | 0:20:33 | 0:20:39 | |
It's about coastal defence and it's about repelling invasions. | 0:20:39 | 0:20:44 | |
And we can tell that by looking at the forts that pepper | 0:20:44 | 0:20:48 | |
the entire coastline, | 0:20:48 | 0:20:50 | |
saying, "Made," "Not made" or "Half made". | 0:20:51 | 0:20:59 | |
So for instance here, we can see a fort that is labelled "Not made" | 0:21:01 | 0:21:05 | |
but it has quite clearly been drawn over | 0:21:05 | 0:21:08 | |
the coastal location at a later point. | 0:21:08 | 0:21:11 | |
so probably over several years Henry looks at this and says, | 0:21:11 | 0:21:17 | |
"This is where I need my coastal fortifications." | 0:21:17 | 0:21:20 | |
Divorce from his Spanish wife Catherine of Aragon | 0:21:23 | 0:21:26 | |
had led Henry to fear a Spanish invasion. | 0:21:26 | 0:21:29 | |
He wanted to build new forts like this to defend his realm. | 0:21:29 | 0:21:33 | |
To help identify where these defences were needed, | 0:21:35 | 0:21:39 | |
the mapmakers prioritised the most vulnerable places. | 0:21:39 | 0:21:42 | |
Certain areas, particularly inlets and sandy bays, where invading | 0:21:48 | 0:21:53 | |
forces could land, are mapped in absolutely minute detail. | 0:21:53 | 0:21:57 | |
Other areas of the map, for instance rocky outlets or cliff tops | 0:22:02 | 0:22:06 | |
where you can't really land a ship, | 0:22:06 | 0:22:09 | |
are not really mapped very accurately at all. | 0:22:09 | 0:22:11 | |
It didn't matter to Henry that this wasn't exactly to scale. | 0:22:13 | 0:22:17 | |
What really mattered to Henry was that he could now sit in London | 0:22:17 | 0:22:21 | |
and he could survey this entire coastline | 0:22:21 | 0:22:23 | |
and he could decide exactly what he wanted to do with it | 0:22:23 | 0:22:27 | |
and where he wanted to put his fortifications. | 0:22:27 | 0:22:29 | |
But the techniques used by Henry's surveyors were evolving rapidly. | 0:22:34 | 0:22:38 | |
In 1544, Henry's forces laid siege | 0:22:45 | 0:22:48 | |
to the French town of Boulogne and occupied it. | 0:22:48 | 0:22:52 | |
Two years later, he commissioned a map that would be accurate enough | 0:22:55 | 0:23:00 | |
for him to define the limits of his newly-conquered territory. | 0:23:00 | 0:23:03 | |
It's a forerunner to the Ordnance Survey maps, | 0:23:05 | 0:23:08 | |
and we can see that because of the | 0:23:08 | 0:23:10 | |
way in which he uses an aerial perspective. | 0:23:10 | 0:23:12 | |
It looks right down onto the land, | 0:23:12 | 0:23:14 | |
and it also has a detailed scale which we can see here. | 0:23:14 | 0:23:18 | |
One inch to a thousand feet. | 0:23:18 | 0:23:21 | |
This was one of the first times that Henry's surveyors attempted | 0:23:28 | 0:23:32 | |
an accurate representation of scale on a strategic map. | 0:23:32 | 0:23:36 | |
It's thought they measured distances by pacing them out. | 0:23:38 | 0:23:42 | |
They also used lengths of rope and compasses to check their findings. | 0:23:42 | 0:23:46 | |
It was one of the most accurate maps ever presented to the King. | 0:23:48 | 0:23:52 | |
Henry himself is believed to have marked out in a red line | 0:23:54 | 0:23:58 | |
the territory that he wanted for the | 0:23:58 | 0:24:01 | |
English, and it's one of the first times that an English ruler has used | 0:24:01 | 0:24:06 | |
a map to draw a political frontier. | 0:24:06 | 0:24:08 | |
Henry had exploited his great power and resources to | 0:24:10 | 0:24:14 | |
improve the technical precision and geographical accuracy of his maps. | 0:24:14 | 0:24:18 | |
But there was still a huge obstacle | 0:24:23 | 0:24:25 | |
to the accurate measurement and mapping of large areas. | 0:24:25 | 0:24:29 | |
The earth isn't flat like a map - it's a sphere. | 0:24:32 | 0:24:35 | |
Just over a hundred years later, | 0:24:38 | 0:24:40 | |
King Louis XIV of France was looking for a way to overcome this problem. | 0:24:40 | 0:24:45 | |
In 1663, he commissioned a map | 0:24:48 | 0:24:50 | |
of the whole of France to help consolidate his power. | 0:24:50 | 0:24:54 | |
This building, the Royal Observatory in Paris, | 0:24:58 | 0:25:02 | |
was at the heart of his ambitious plans. | 0:25:02 | 0:25:05 | |
When we think of a modern map, we tend to imagine an entirely | 0:25:08 | 0:25:12 | |
accurate representation of the world on paper. | 0:25:12 | 0:25:15 | |
The reason why I've come here | 0:25:15 | 0:25:17 | |
is because this is where that idea was born. | 0:25:17 | 0:25:20 | |
And it happened here because of an extraordinary collision of power, | 0:25:22 | 0:25:27 | |
politics and scientific progress - | 0:25:27 | 0:25:29 | |
the Enlightenment. | 0:25:29 | 0:25:32 | |
The leading astronomer at the Observatory | 0:25:32 | 0:25:34 | |
was Giovanni Domenico Cassini. | 0:25:34 | 0:25:36 | |
He found the solution to the problem of accurately measuring | 0:25:36 | 0:25:40 | |
distances across the globe in the science of astronomy. | 0:25:40 | 0:25:43 | |
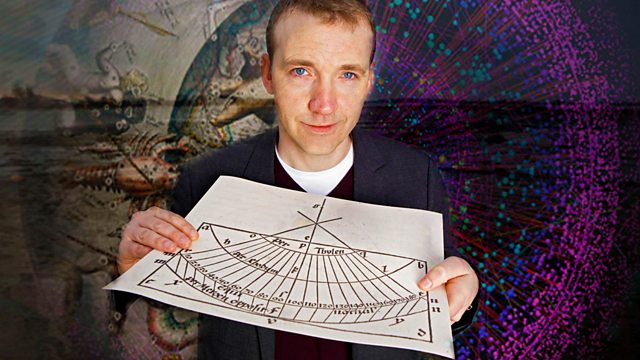
Map-makers already knew how to measure latitude - | 0:25:47 | 0:25:50 | |
the distance north or south of the equator - | 0:25:50 | 0:25:53 | |
by observing the height of the sun. | 0:25:53 | 0:25:56 | |
But a way to measure longitude - | 0:25:57 | 0:25:59 | |
the distance east or west of a point - had still to be found. | 0:25:59 | 0:26:04 | |
Thanks to a dramatic increase in the power of telescopic lenses, | 0:26:08 | 0:26:13 | |
Cassini found the answer | 0:26:13 | 0:26:14 | |
by observing the eclipses of Jupiter's moons. | 0:26:14 | 0:26:17 | |
He timed the eclipses in Paris and then compared this with the time | 0:26:21 | 0:26:26 | |
the same eclipses were seen in Brest, | 0:26:26 | 0:26:29 | |
600km to the west of the city. | 0:26:29 | 0:26:31 | |
The apparent time difference between | 0:26:31 | 0:26:34 | |
the two observations was then used to help calculate longitude. | 0:26:34 | 0:26:38 | |
Cassini sent out teams of astronomers to record | 0:26:38 | 0:26:42 | |
the timing of the eclipses as they occurred along the French coastline. | 0:26:42 | 0:26:47 | |
This is just a sample of the voluminous correspondence | 0:26:54 | 0:26:57 | |
that came back to Cassini | 0:26:57 | 0:26:59 | |
here at the observatory by his surveyors spread right over France. | 0:26:59 | 0:27:04 | |
Every location that they went to, | 0:27:04 | 0:27:06 | |
they took detailed measurements feeding those measurements back | 0:27:06 | 0:27:09 | |
to Cassini to start put together an accurate measurement of longitude | 0:27:09 | 0:27:13 | |
right across France. | 0:27:13 | 0:27:14 | |
This is a letter from Brest with one of his surveyors | 0:27:14 | 0:27:17 | |
assessing the eclipses, giving an exact time at which they took place. | 0:27:17 | 0:27:23 | |
And this kind of precision | 0:27:23 | 0:27:25 | |
had never been applied to map making ever before. | 0:27:25 | 0:27:28 | |
Finally, in May 1682 the King's surveyors were able to present him | 0:27:28 | 0:27:33 | |
with the first true outline of France. | 0:27:33 | 0:27:36 | |
The coastline was revealed to be | 0:27:39 | 0:27:41 | |
astonishingly different from the way it appeared on earlier maps. | 0:27:41 | 0:27:44 | |
France was shown to be 20% smaller than all previous estimates. | 0:27:46 | 0:27:51 | |
Louis was horrified. | 0:27:51 | 0:27:54 | |
Science, said Louis, had cost him more territory | 0:27:54 | 0:27:58 | |
than any invading enemy. | 0:27:58 | 0:27:59 | |
The shape of the coastline was now established. | 0:28:11 | 0:28:14 | |
But there was an even greater task ahead - | 0:28:14 | 0:28:17 | |
to map out the whole of the interior of France. | 0:28:17 | 0:28:21 | |
In the mid 18th century, surveyors arrived here | 0:28:22 | 0:28:26 | |
at Chateau de Champs-sur-Marne just outside Paris. | 0:28:26 | 0:28:29 | |
They'd come to calculate the smaller distances | 0:28:31 | 0:28:33 | |
between a series of fixed points in the grounds. | 0:28:33 | 0:28:36 | |
To do this they used another scientific technique | 0:28:36 | 0:28:38 | |
called triangulation. | 0:28:38 | 0:28:40 | |
France was about to be divided into | 0:28:40 | 0:28:42 | |
hundreds of carefully measured triangles. | 0:28:42 | 0:28:45 | |
Historian of mapmaking, Daniel Schelstraete | 0:28:53 | 0:28:57 | |
is about to show me how it was done. | 0:28:57 | 0:29:00 | |
TRANSLATION: In order to create a triangle, | 0:29:00 | 0:29:03 | |
first of all they had to measure the distance of a straight line. | 0:29:03 | 0:29:08 | |
The problem back then | 0:29:08 | 0:29:09 | |
was that measuring it was very hard and took a long time. | 0:29:09 | 0:29:14 | |
So they had to find ground that was totally flat, or work | 0:29:14 | 0:29:18 | |
for several days stopping and levelling it, | 0:29:18 | 0:29:22 | |
which was very difficult. | 0:29:22 | 0:29:23 | |
And the rulers that were used were only four metres long. | 0:29:23 | 0:29:28 | |
Despite these difficulties, a straight line would have to | 0:29:30 | 0:29:33 | |
be measured between the two fixed points. | 0:29:33 | 0:29:36 | |
It was called a baseline and it formed the first side of a triangle. | 0:29:36 | 0:29:40 | |
Standing at one end of the base line, Daniel is demonstrating | 0:29:42 | 0:29:45 | |
how they worked out the rest of the dimensions of the triangle. | 0:29:45 | 0:29:49 | |
So, we want to look over there at the statue | 0:29:55 | 0:29:57 | |
which you can see is at the other end of the line. | 0:29:57 | 0:30:00 | |
And if you look through the lens, | 0:30:00 | 0:30:03 | |
you can see that the image is upside down. | 0:30:03 | 0:30:05 | |
And then we look over to the pigeon house through the other lens. | 0:30:05 | 0:30:09 | |
The pigeon house marks the third point of the triangle. | 0:30:11 | 0:30:14 | |
And then the instrument shows you the angle of the corner of the triangle. | 0:30:16 | 0:30:20 | |
75 degrees. | 0:30:20 | 0:30:22 | |
Now the task is repeated at the other end of the baseline | 0:30:24 | 0:30:28 | |
and a second angle is measured. | 0:30:28 | 0:30:30 | |
From this information the lengths of the other two sides of the triangle | 0:30:32 | 0:30:36 | |
can be worked out using the laws of trigonometry. | 0:30:36 | 0:30:39 | |
TRANSLATION: The operator would take the measurements | 0:30:39 | 0:30:45 | |
and then write them down in a notebook. | 0:30:45 | 0:30:47 | |
We're lucky to have an original notebook from these times | 0:30:47 | 0:30:51 | |
with the name of the operator, | 0:30:51 | 0:30:53 | |
and, "Observations made on the Plain of Paris and Meaux". | 0:30:53 | 0:30:57 | |
-So these are the measurements from this exact spot? -Exactly. | 0:30:59 | 0:31:03 | |
So, here is the description. You have a chimney. | 0:31:05 | 0:31:07 | |
Here's a reference to the pediment. | 0:31:07 | 0:31:11 | |
And everything that was located would be written down. | 0:31:11 | 0:31:15 | |
And when it was necessary there are even a few sketches. | 0:31:15 | 0:31:18 | |
Obviously the secret, the impressiveness of creating these maps | 0:31:20 | 0:31:25 | |
lies in integrating all of this information across a whole territory. | 0:31:25 | 0:31:29 | |
It's all thanks to the principle of triangulation. | 0:31:29 | 0:31:32 | |
The dimensions of one triangle were used to create another. | 0:31:35 | 0:31:39 | |
Slowly, a network of triangles was used to calculate accurate distances between places all over the France. | 0:31:39 | 0:31:46 | |
This ambitious enterprise would transform the nation. | 0:31:51 | 0:31:54 | |
At that time, France was a collection of diverse regions, | 0:31:54 | 0:31:59 | |
each with its own identity. | 0:31:59 | 0:32:01 | |
There were hundreds of French dialects, | 0:32:01 | 0:32:04 | |
but now the whole country was slowly being brought together in one map. | 0:32:04 | 0:32:08 | |
The Carte de Cassini was finally completed in 1789, | 0:32:17 | 0:32:21 | |
by which time Louis XVI was on the throne. | 0:32:21 | 0:32:24 | |
Over 120 years, four generations of the Cassini family | 0:32:24 | 0:32:28 | |
had devoted their lives to mapping France. | 0:32:28 | 0:32:31 | |
This is the Carte de Cassini | 0:32:33 | 0:32:35 | |
and it's the first time I've actually seen it | 0:32:35 | 0:32:37 | |
and what strikes me, of course, as I open it | 0:32:37 | 0:32:40 | |
is that it's not just a map, it's a book of maps. | 0:32:40 | 0:32:44 | |
And this is the map of France. | 0:32:44 | 0:32:47 | |
Down the left-hand side, table of longitude and latitude. | 0:32:47 | 0:32:51 | |
You look at the map itself | 0:32:54 | 0:32:56 | |
and it's a series of squares created from the triangulation process. | 0:32:56 | 0:33:02 | |
Here is the whole French nation, mapped in exact scientific detail. | 0:33:02 | 0:33:07 | |
And if we turn to the map of Paris... | 0:33:13 | 0:33:16 | |
we can see all the regions of Paris mapped. | 0:33:16 | 0:33:19 | |
You can see the centre here | 0:33:21 | 0:33:24 | |
and that's where we are - down here on the observatory, just there. | 0:33:24 | 0:33:28 | |
And it goes right through the entire country. | 0:33:28 | 0:33:33 | |
Page after page are of different areas of France, | 0:33:33 | 0:33:38 | |
but the way in which they are being portrayed is exactly the same. | 0:33:38 | 0:33:42 | |
All the symbols, all the signs are standardised. | 0:33:45 | 0:33:50 | |
The symbols for forests... | 0:33:50 | 0:33:53 | |
..the symbols for rivers... | 0:33:58 | 0:34:01 | |
..the symbols for towns... | 0:34:04 | 0:34:06 | |
..and what's also significant here | 0:34:11 | 0:34:13 | |
is the fact that the language is also being standardised. | 0:34:13 | 0:34:16 | |
This is Parisian French. | 0:34:16 | 0:34:18 | |
Page after page is using the same kind of language. | 0:34:18 | 0:34:22 | |
Standardising the language, standardising the map. | 0:34:22 | 0:34:25 | |
The scale is also exactly the same. | 0:34:33 | 0:34:36 | |
Down here the scale bar, which tells you | 0:34:36 | 0:34:39 | |
exactly the scale that's being used on this map. | 0:34:39 | 0:34:42 | |
It's actually 1:86400. | 0:34:42 | 0:34:44 | |
It is that precise. | 0:34:44 | 0:34:47 | |
And it's staggering. To look at this is absolutely amazing. | 0:34:48 | 0:34:53 | |
This is standardisation, but it's beautiful standardisation. | 0:34:53 | 0:34:56 | |
These are maps for the King. | 0:34:56 | 0:34:58 | |
It wants to look beautiful as well as being precise. | 0:34:58 | 0:35:01 | |
But the map made to serve the King | 0:35:03 | 0:35:05 | |
was about to become a tool of revolution. | 0:35:05 | 0:35:08 | |
On the 14th July, | 0:35:16 | 0:35:17 | |
just as the finishing touches were being made to the map, | 0:35:17 | 0:35:21 | |
the revolutionary mob was storming the Bastille. | 0:35:21 | 0:35:24 | |
Two days later they invaded the Paris Observatory. | 0:35:26 | 0:35:29 | |
The new regime claimed the Carte de Cassini as national property. | 0:35:34 | 0:35:37 | |
They used it to help carry out their sweeping administrative reforms. | 0:35:41 | 0:35:45 | |
This was the map on which | 0:35:45 | 0:35:46 | |
the boundaries of the new departments were drawn, | 0:35:46 | 0:35:49 | |
the regional administrative units still used today. | 0:35:49 | 0:35:53 | |
The Carte de Cassini would have an even greater legacy. | 0:36:12 | 0:36:16 | |
It would help forge a powerful new national identity. | 0:36:16 | 0:36:19 | |
For the very first time in history, here was a map which centralised | 0:36:19 | 0:36:24 | |
and standardised an image of the nation, of France. | 0:36:24 | 0:36:28 | |
It allowed all kinds of regional variations to be subsumed into | 0:36:28 | 0:36:33 | |
one nation state image - the map of Cassini. | 0:36:33 | 0:36:36 | |
People could identify, despite their regional variations, | 0:36:36 | 0:36:40 | |
right across this map, | 0:36:40 | 0:36:41 | |
even with people that they'd never even meet. | 0:36:41 | 0:36:44 | |
It was an image of a unified nation state, | 0:36:44 | 0:36:48 | |
even when the country was being torn apart by the revolutionary terror. | 0:36:48 | 0:36:51 | |
This triumph of science and enlightenment | 0:36:59 | 0:37:01 | |
had become a potent political tool. | 0:37:01 | 0:37:03 | |
This was France as these revolutionary nation builders | 0:37:05 | 0:37:09 | |
wanted it to be. | 0:37:09 | 0:37:10 | |
One language, one nation, one map. | 0:37:10 | 0:37:14 | |
While the French were uniting around their new national map, | 0:37:28 | 0:37:33 | |
the British, with their expanding overseas empire, | 0:37:33 | 0:37:35 | |
were charting the oceans. | 0:37:35 | 0:37:37 | |
Captain James Cook was | 0:37:40 | 0:37:41 | |
one of Britain's pioneering explorers and navigators. | 0:37:41 | 0:37:44 | |
In August 1768, he embarked on an epic voyage bound for the Pacific. | 0:37:44 | 0:37:50 | |
The latest scientific inventions gave Cook's maps a new kind of | 0:37:57 | 0:38:00 | |
authority and the power to lay claim to the territory they depicted. | 0:38:00 | 0:38:06 | |
Cook's mastery of science and navigation confirmed him | 0:38:08 | 0:38:11 | |
as a great hero and genius of the Age of Enlightenment. | 0:38:11 | 0:38:14 | |
But on the island of Tahiti, | 0:38:19 | 0:38:20 | |
Cook met his match in a local navigator called Tupaia, | 0:38:20 | 0:38:24 | |
who'd never even drawn a map in his life. | 0:38:24 | 0:38:27 | |
Tupaia could sail across the Pacific, | 0:38:35 | 0:38:37 | |
a third of the earth's surface, without the use of paper maps. | 0:38:37 | 0:38:41 | |
This went against all of Cook's training and experience. | 0:38:41 | 0:38:45 | |
He was so intrigued that he asked Tupaia | 0:38:45 | 0:38:48 | |
to draw a chart of the Ocean, | 0:38:48 | 0:38:50 | |
showing the location of all the islands he knew. | 0:38:50 | 0:38:53 | |
This is a copy of the map Cook encouraged Tupaia to create. | 0:38:53 | 0:38:58 | |
The sheer scale of Tupaia's knowledge shown on this map | 0:39:02 | 0:39:05 | |
is absolutely astonishing. | 0:39:05 | 0:39:06 | |
74 islands, half of which weren't actually even mapped by Westerners, | 0:39:06 | 0:39:11 | |
but here they are being shown by Tupaia. | 0:39:11 | 0:39:14 | |
Cook wrote in his journal that Tupaia "knew more of the geography | 0:39:15 | 0:39:19 | |
"of the islands situated in these seas than anyone he'd ever met." | 0:39:19 | 0:39:24 | |
He said that any ship would be better off with Tupaia aboard. | 0:39:24 | 0:39:28 | |
Tahiarii Pariente is one of Tupaia's descendents. | 0:39:29 | 0:39:34 | |
A Polynesian navigator himself, | 0:39:34 | 0:39:36 | |
he's studied the techniques used by his ancestors. | 0:39:36 | 0:39:38 | |
The navigator had knowledge of the stars, he knowledge about climate, | 0:39:40 | 0:39:45 | |
he had knowledge about how the time would go by in a year, | 0:39:45 | 0:39:49 | |
so the difference between seasons. | 0:39:49 | 0:39:51 | |
I mean, there is no Polynesian culture without navigation. | 0:39:51 | 0:39:54 | |
We're islanders, so we hop from island to island. | 0:39:54 | 0:39:58 | |
For 3,000 years the Polynesians had been exploring and colonising | 0:39:59 | 0:40:04 | |
the islands of the Pacific. | 0:40:04 | 0:40:05 | |
They'd even reached America at least a century before Columbus. | 0:40:05 | 0:40:10 | |
Tupaia was drawing on ancestral knowledge | 0:40:10 | 0:40:13 | |
passed down through countless generations. | 0:40:13 | 0:40:15 | |
When you get out from an island, until it disappears | 0:40:18 | 0:40:21 | |
behind the horizon, you use the island as a bearing. | 0:40:21 | 0:40:24 | |
So then you start using the stars, | 0:40:24 | 0:40:26 | |
but then you don't have stars all the time, you have clouds, you have rain | 0:40:26 | 0:40:30 | |
then you use the wave patterns in the ocean | 0:40:30 | 0:40:33 | |
and you pull out certain fish and they know this fish only comes | 0:40:33 | 0:40:38 | |
that far away from the islands, or that kind of birds. | 0:40:38 | 0:40:41 | |
They know how far away they can fly, | 0:40:41 | 0:40:44 | |
so you have to understand what's around you. | 0:40:44 | 0:40:47 | |
When Tupaia drew his map he was encouraged to place his knowledge | 0:40:49 | 0:40:54 | |
within a western framework. | 0:40:54 | 0:40:56 | |
But on closer inspection, it reveals a Polynesian perspective. | 0:40:56 | 0:40:59 | |
Even the way of indicating direction is different. | 0:40:59 | 0:41:02 | |
All the Western maps here are north to south. | 0:41:04 | 0:41:09 | |
The one thing you see on every map is north. | 0:41:09 | 0:41:11 | |
We didn't really care about the north, | 0:41:11 | 0:41:14 | |
we only cared about is west because that's where everything goes. | 0:41:14 | 0:41:18 | |
That's where the sun goes down, where the stars goes down, | 0:41:18 | 0:41:21 | |
where the wind blows. | 0:41:21 | 0:41:22 | |
This map is the result of a clash, isn't it, | 0:41:24 | 0:41:26 | |
between two different ways of navigating? | 0:41:26 | 0:41:28 | |
There's a Polynesian way of navigating | 0:41:28 | 0:41:30 | |
and then there's the Western method that Cook uses | 0:41:30 | 0:41:34 | |
and they're in a sense colliding with each other. | 0:41:34 | 0:41:38 | |
They both work, but you can't really put them together, can you? | 0:41:38 | 0:41:41 | |
No. The Polynesian state of mind is totally opposite to the Western one. | 0:41:41 | 0:41:46 | |
We don't go anywhere, we stay where we are | 0:41:46 | 0:41:49 | |
and the island comes to you, or your destination comes to you. | 0:41:49 | 0:41:52 | |
So in Western navigation, we go to the island, | 0:41:52 | 0:41:55 | |
but in Polynesian traditions the island comes to you. | 0:41:55 | 0:41:59 | |
You don't move. The canoe don't move, it's your centre, it's where you are. | 0:41:59 | 0:42:03 | |
And if we look at this map, what's significant about it? | 0:42:03 | 0:42:08 | |
The scale, for example, on the map | 0:42:08 | 0:42:11 | |
is not related maybe to the real scale of the geographic place, | 0:42:11 | 0:42:16 | |
but maybe related to the importance of the place. | 0:42:16 | 0:42:19 | |
Like Rotuma is drawn really big, | 0:42:19 | 0:42:22 | |
but it does echo in a lot of legends, myths and stories. | 0:42:22 | 0:42:28 | |
So, it is big in history, not in width or height. | 0:42:28 | 0:42:33 | |
It's like a code. | 0:42:33 | 0:42:34 | |
If you don't have the key, you won't understand the message. | 0:42:34 | 0:42:37 | |
Tupaia's map is an extraordinary document, | 0:42:39 | 0:42:42 | |
and not only for what it shows | 0:42:42 | 0:42:43 | |
about Tupaia's deeply ingrained knowledge of the Pacific Islands. | 0:42:43 | 0:42:47 | |
Despite the great scientific leaps forward in the West, | 0:42:49 | 0:42:53 | |
Tupaia's map shows us that other cultures had different but equally | 0:42:53 | 0:42:57 | |
effective ways of navigating their way across the Earth's surface. | 0:42:57 | 0:43:02 | |
Back in England, the drive to make maps | 0:43:18 | 0:43:20 | |
with greater scientific accuracy was proceeding with military efficiency. | 0:43:20 | 0:43:24 | |
In 1784, here on Hounslow Heath, the army was taking up the challenge of | 0:43:27 | 0:43:32 | |
mapping Britain under the leadership of Major General William Roy. | 0:43:32 | 0:43:36 | |
Roy would use the same technique of triangulation as the French. | 0:43:39 | 0:43:43 | |
So the accuracy of his map | 0:43:43 | 0:43:44 | |
depended on the accurate measurement of a baseline. | 0:43:44 | 0:43:47 | |
General Roy was on Hounslow Heath | 0:43:53 | 0:43:55 | |
here, taking a measurement, a very precise measurement, | 0:43:55 | 0:43:59 | |
which would be the basis of the survey | 0:43:59 | 0:44:01 | |
that they would do to cover the whole of the country. | 0:44:01 | 0:44:04 | |
So they only need the one line to begin with? | 0:44:04 | 0:44:06 | |
Critically, yes. The distances which were calculated | 0:44:06 | 0:44:10 | |
across the country were based on this one measurement at the start. | 0:44:10 | 0:44:15 | |
To reduce the risk of error, | 0:44:15 | 0:44:17 | |
Roy had to measure a straight line at least 8km long. | 0:44:17 | 0:44:22 | |
The line was actually roughly measured | 0:44:22 | 0:44:25 | |
with a chain similar to this. | 0:44:25 | 0:44:28 | |
This one is only a 20 metre chain. The one that Roy had was 100ft chain. | 0:44:28 | 0:44:33 | |
It weighed about 18 pounds and you had five men to actually use it. | 0:44:33 | 0:44:38 | |
So five people would be dragging this out | 0:44:38 | 0:44:41 | |
rather than just the two of us. | 0:44:41 | 0:44:43 | |
Yes. Pulling this 27,000 feet. | 0:44:43 | 0:44:46 | |
Let's see if we can unravel it without getting some kinks in it. | 0:44:46 | 0:44:50 | |
OK. What do we do with kinks? | 0:44:50 | 0:44:52 | |
-We have to get rid of them. -Oh, dear. | 0:44:52 | 0:44:55 | |
-So we'll have to... That's better. It's looking better. -OK. | 0:44:55 | 0:44:59 | |
That's right. Sit your end of the chain against the marker point. | 0:45:02 | 0:45:06 | |
Yep. | 0:45:06 | 0:45:09 | |
And then you would come to this point and we would proceed along the baseline. | 0:45:09 | 0:45:13 | |
OK. | 0:45:13 | 0:45:15 | |
With the real chain, soldiers would have repeated the process | 0:45:15 | 0:45:19 | |
nearly 300 times to establish the path of the baseline. | 0:45:19 | 0:45:23 | |
OK. That's about right. | 0:45:23 | 0:45:25 | |
I can see my point behind you. | 0:45:25 | 0:45:27 | |
-You are on line, so if you could mark the spot, please? -OK. | 0:45:27 | 0:45:32 | |
Roy then used 20 ft wooden poles to make a more accurate measurement. | 0:45:32 | 0:45:36 | |
But, in the British climate, wood proved to be an unreliable tool. | 0:45:36 | 0:45:41 | |
On wet days it expanded, on dry days it shrank. | 0:45:41 | 0:45:44 | |
Roy came up with a new solution - | 0:45:47 | 0:45:50 | |
a set of glass rods mounted on tripods. | 0:45:50 | 0:45:53 | |
To advance across the base, they would have then set up another tripod | 0:45:53 | 0:45:57 | |
and they would have inserted another piece of glass | 0:45:57 | 0:46:01 | |
and butted it to the end of this one here. | 0:46:01 | 0:46:03 | |
Then they would have just kept moving across the base. | 0:46:03 | 0:46:06 | |
So it's the same principle as with the chains, | 0:46:06 | 0:46:08 | |
but it's just more accurate? | 0:46:08 | 0:46:10 | |
That is correct, yes. | 0:46:10 | 0:46:11 | |
The glass was much more stable than the wooden rods were. | 0:46:11 | 0:46:16 | |
They didn't go out of true in the same way and they could have | 0:46:16 | 0:46:19 | |
confidence that their measurement across this base was much better | 0:46:19 | 0:46:23 | |
and the precision that they were looking for. | 0:46:23 | 0:46:27 | |
The measurement of the all-important baseline | 0:46:28 | 0:46:31 | |
took over four months to complete. | 0:46:31 | 0:46:33 | |
The same line formed the basis of the first | 0:46:39 | 0:46:42 | |
British Ordnance Survey map, | 0:46:42 | 0:46:44 | |
which covered the area | 0:46:44 | 0:46:45 | |
all the way from London to the south coast in Kent. | 0:46:45 | 0:46:48 | |
A memorial to William Roy's work | 0:46:59 | 0:47:01 | |
can still be found at the end of his historic line. | 0:47:01 | 0:47:03 | |
It's rather weird to find | 0:47:09 | 0:47:10 | |
this strange monument to our nation's mapping heritage | 0:47:10 | 0:47:13 | |
here at the end of a suburban cul-de-sac | 0:47:13 | 0:47:16 | |
on the outskirts of London. | 0:47:16 | 0:47:18 | |
The upended cannon reminds us | 0:47:18 | 0:47:20 | |
of the Ordnance Survey's origins in the military. | 0:47:20 | 0:47:24 | |
And here is a plaque | 0:47:24 | 0:47:25 | |
commemorating the achievements of Major General William Roy. | 0:47:25 | 0:47:30 | |
And it describes the fact | 0:47:30 | 0:47:31 | |
that "he conceived the idea of carrying out the triangulation | 0:47:31 | 0:47:35 | |
"of this country and of constructing a complete and accurate map | 0:47:35 | 0:47:40 | |
"and therefore laid the foundation of the Ordnance Survey." | 0:47:40 | 0:47:44 | |
And it also describes the measurement of the baseline | 0:47:44 | 0:47:49 | |
between King's Arbour and Hampton Poor House | 0:47:49 | 0:47:51 | |
as measured by Roy - 27,404.01ft, | 0:47:51 | 0:47:57 | |
which is just over 8km. | 0:47:57 | 0:48:00 | |
We now know that was only about three inches out. | 0:48:00 | 0:48:02 | |
Not bad going, really. | 0:48:02 | 0:48:05 | |
Thanks to William Roy's vision and determination, the whole of Britain | 0:48:10 | 0:48:13 | |
would be mapped using some of the most accurate measurements on Earth. | 0:48:13 | 0:48:17 | |
By the early 20th century, | 0:48:33 | 0:48:34 | |
the surveying of the rest of the world was underway | 0:48:34 | 0:48:37 | |
and just like Britain and France, | 0:48:37 | 0:48:39 | |
each nation took a different approach to the task. | 0:48:39 | 0:48:42 | |
As a result, there was a bewildering range of map-making styles using | 0:48:48 | 0:48:52 | |
different scales, symbols and languages. | 0:48:52 | 0:48:56 | |
But a bold new initiative set out | 0:48:57 | 0:48:59 | |
to create a map that could be understood by everyone. | 0:48:59 | 0:49:03 | |
It was called the International Map of the World. | 0:49:06 | 0:49:09 | |
International, because each country would create a map | 0:49:09 | 0:49:12 | |
of its individual territory according to agreed standards. | 0:49:12 | 0:49:16 | |
There would be 2,500 maps | 0:49:16 | 0:49:19 | |
and when they were all put together they would depict the entire world. | 0:49:19 | 0:49:23 | |
At a conference in Paris in 1913, | 0:49:23 | 0:49:26 | |
34 nations agreed to create a comprehensive series of regional maps | 0:49:26 | 0:49:31 | |
on a universal scale of one to a million. | 0:49:31 | 0:49:35 | |
They would be known as the Millionth Maps. | 0:49:35 | 0:49:38 | |
This is the millionth map of the South Coast of England. | 0:49:42 | 0:49:45 | |
This one shows North-Western America around San Francisco. | 0:49:45 | 0:49:49 | |
Both these maps look rather different | 0:49:52 | 0:49:54 | |
and that's mainly because of the varying terrain that they both show. | 0:49:54 | 0:49:58 | |
But there are also many similarities. | 0:49:58 | 0:50:00 | |
Greenwich is the prime meridian and relief is marked | 0:50:00 | 0:50:03 | |
by contour lines whose height is all measured in metres. | 0:50:03 | 0:50:08 | |
The colours are also completely standardised here, | 0:50:08 | 0:50:11 | |
so the roads are all in red, the railways are in black. | 0:50:11 | 0:50:17 | |
And, of course, the scale on this map is one to a million. | 0:50:17 | 0:50:20 | |
Each country would adopt the same set of standards | 0:50:22 | 0:50:26 | |
in the spirit of international co-operation. | 0:50:26 | 0:50:29 | |
The combined result would be a standardised map of the world | 0:50:30 | 0:50:34 | |
that was intended to transcend national differences. | 0:50:34 | 0:50:38 | |
But not every nation had the power and resources needed | 0:50:38 | 0:50:41 | |
to send surveyors into the unmapped territories of the world. | 0:50:41 | 0:50:45 | |
This shows the areas mapped according to the principles | 0:50:47 | 0:50:51 | |
and standards of the International Map of the World by the mid-1920s. | 0:50:51 | 0:50:55 | |
It's a fascinating snapshot of the world at that time, | 0:50:55 | 0:50:58 | |
and not only because it shows where had been mapped, but also by whom. | 0:50:58 | 0:51:03 | |
All these areas in Africa, at the time under French colonial rule - | 0:51:03 | 0:51:08 | |
Morocco, Algeria, Niger, Chad - are all mapped by the French. | 0:51:08 | 0:51:14 | |
Over in Indonesia, Dutch dominions here are mapped by the Dutch. | 0:51:14 | 0:51:20 | |
The British Empire, marked on the map here as GB, | 0:51:20 | 0:51:24 | |
is also mapping its own imperial territories. | 0:51:24 | 0:51:27 | |
Most of India here is mapped by GB. | 0:51:27 | 0:51:31 | |
Whole parts of East Africa, Southern Africa | 0:51:31 | 0:51:35 | |
and also parts of the Middle East. | 0:51:35 | 0:51:37 | |
Despite the project's best intentions, the Millionth Maps | 0:51:41 | 0:51:45 | |
were being used to further the imperial interests of the West. | 0:51:45 | 0:51:48 | |
By the outbreak of World War I, the project's original spirit | 0:51:50 | 0:51:53 | |
of international co-operation was fading away. | 0:51:53 | 0:51:56 | |
Far from transcending national differences, | 0:52:00 | 0:52:02 | |
the International Map of the World became an extension of them. | 0:52:02 | 0:52:06 | |
Up to 40% of all of the developing world's national borders | 0:52:19 | 0:52:22 | |
were defined and mapped by the British or the French. | 0:52:22 | 0:52:27 | |
Flushed with victory after the First World War, | 0:52:27 | 0:52:30 | |
they would use maps to consolidate their power in the Middle East. | 0:52:30 | 0:52:35 | |
For centuries, the region between Mesopotamia and Saudi Arabia | 0:52:38 | 0:52:42 | |
had been a land without fixed frontiers, | 0:52:42 | 0:52:44 | |
as this British army map from 1907 illustrates. | 0:52:44 | 0:52:49 | |
This is a map without divisions and boundaries. | 0:52:49 | 0:52:52 | |
What it shows is the movement of nomadic Arab tribespeople | 0:52:54 | 0:52:57 | |
across this whole region. | 0:52:57 | 0:52:59 | |
So if you look in the bottom left corner, | 0:52:59 | 0:53:01 | |
you have the Shammar. This is generally their region, | 0:53:01 | 0:53:04 | |
but they're also described as wintering up here. | 0:53:04 | 0:53:08 | |
So this is the movement of peoples being shown in a very fluid way | 0:53:08 | 0:53:12 | |
without any linear boundaries imposing restrictions upon them. | 0:53:12 | 0:53:16 | |
I belong to the Shammar tribe and the region of north Arabia | 0:53:23 | 0:53:27 | |
was predominantly populated by nomadic tribes | 0:53:27 | 0:53:30 | |
with their own territories. | 0:53:30 | 0:53:32 | |
But these territories, we can not describe them as rigid or fixed. | 0:53:35 | 0:53:41 | |
They had fluctuating boundaries. | 0:53:41 | 0:53:44 | |
These tribal groups would travel all the way up to the north | 0:53:44 | 0:53:47 | |
in search of pasture and water, but in the very, very hot months | 0:53:47 | 0:53:51 | |
they would actually retreat, either near oasis | 0:53:51 | 0:53:53 | |
or go even further, to a cooler climate. | 0:53:53 | 0:53:57 | |
So migration in that part of the world was a common feature of life. | 0:53:58 | 0:54:04 | |
Following the collapse of the Ottoman Empire | 0:54:06 | 0:54:09 | |
after the First World War, the victorious European powers | 0:54:09 | 0:54:12 | |
decreed that a new nation state was to be carved out of Mesopotamia. | 0:54:12 | 0:54:16 | |
It would be called Iraq. | 0:54:16 | 0:54:18 | |
The border between Iraq and Saudi Arabia was decided by two men | 0:54:23 | 0:54:28 | |
at a conference in 1922. | 0:54:28 | 0:54:30 | |
Sir Percy Cox of the British Colonial Office | 0:54:32 | 0:54:35 | |
had an uncompromising approach. | 0:54:35 | 0:54:38 | |
He wanted to draw a line straight through the desert. | 0:54:38 | 0:54:40 | |
For Ibn Saud, the King of Saudi Arabia, this was an alien concept. | 0:54:42 | 0:54:47 | |
Ibn Saud argued that to impose linear boundaries | 0:54:49 | 0:54:52 | |
upon his tribespeople was completely unsuitable | 0:54:52 | 0:54:56 | |
because it didn't work for the way in which they moved | 0:54:56 | 0:54:58 | |
and they transmigrated across this whole space. | 0:54:58 | 0:55:02 | |
What he suggested instead was to keep the boundaries fluid | 0:55:02 | 0:55:06 | |
and to keep them open. | 0:55:06 | 0:55:08 | |
This idea of making a map to reflect fluidity and openness | 0:55:10 | 0:55:14 | |
was mocked by the British. | 0:55:14 | 0:55:16 | |
This is an eyewitness account written about the conference | 0:55:16 | 0:55:20 | |
by one of the translators. | 0:55:20 | 0:55:21 | |
"At a private meeting, at which | 0:55:21 | 0:55:24 | |
"only Sir Percy, Ibn Saud and I were present, he lost all patience | 0:55:24 | 0:55:29 | |
"over what he called the childish attitude of Ibn Saud | 0:55:29 | 0:55:33 | |
"in his tribal boundary idea. | 0:55:33 | 0:55:35 | |
"It was astonishing to see Ibn Saud being reprimanded | 0:55:35 | 0:55:39 | |
"like a naughty schoolboy by His Majesty's High Commissioner, | 0:55:39 | 0:55:43 | |
"and being told sharply that he, Sir Percy Cox, | 0:55:43 | 0:55:46 | |
"would himself decide on the type and general line of the frontier. | 0:55:46 | 0:55:51 | |
"Sir Percy took a red pencil | 0:55:51 | 0:55:54 | |
"and very carefully drew in on the map of Arabia a boundary line." | 0:55:54 | 0:55:59 | |
So from that moment, these local tribal population, | 0:56:05 | 0:56:09 | |
brothers, lineages or clans, would find themselves divided. | 0:56:09 | 0:56:14 | |
Some of them would be part of Saudi Arabia, | 0:56:14 | 0:56:17 | |
others would have become Iraqis, | 0:56:17 | 0:56:18 | |
and yet another branch would have become Kuwaitis, | 0:56:18 | 0:56:21 | |
and they could not continue as animal herders | 0:56:21 | 0:56:24 | |
and therefore the animal economy collapsed because nomadism | 0:56:24 | 0:56:28 | |
was definitely based on the seasonal migration. | 0:56:28 | 0:56:31 | |
So economically, yes, the region was affected. | 0:56:31 | 0:56:34 | |
But in addition, networks of hospitality, of trust and solidarity, | 0:56:34 | 0:56:40 | |
all that had to vanish. | 0:56:40 | 0:56:42 | |
The precision of enlightenment science | 0:56:47 | 0:56:49 | |
had combined with the rule of Empire | 0:56:49 | 0:56:51 | |
to make a map with the power to destroy an ancient way of life. | 0:56:51 | 0:56:56 | |
Map makers throughout history | 0:56:58 | 0:57:01 | |
have created wonderful windows on the world, | 0:57:01 | 0:57:04 | |
and Western science has provided the tools | 0:57:04 | 0:57:07 | |
to make modern maps more accurate than ever before. | 0:57:07 | 0:57:11 | |
But the mapping of Iraq is a stark reminder | 0:57:11 | 0:57:13 | |
that maps can also be devastating tools of political power, | 0:57:13 | 0:57:18 | |
and we are still living with the consequences to this day. | 0:57:18 | 0:57:22 | |
In the next programme, maps show the way to heaven, | 0:57:27 | 0:57:30 | |
provoke prejudice, | 0:57:30 | 0:57:33 | |
and bend the world out of shape. | 0:57:33 | 0:57:36 | |
Subtitles by Red Bee Media Ltd | 0:57:45 | 0:57:48 | |
E-mail [email protected] | 0:57:48 | 0:57:51 |